Journal of Northeastern University(Natural Science) ›› 2025, Vol. 46 ›› Issue (1): 145-152.DOI: 10.12068/j.issn.1005-3026.2025.20230211
• Management Science • Previous Articles
Yan-bo ZHANG, Ya-ning CHEN, Xiao-nan LIU
Received:2023-07-19
Online:2025-01-15
Published:2025-03-25
CLC Number:
Yan-bo ZHANG, Ya-ning CHEN, Xiao-nan LIU. Influence of Environmental Protection Vertical Management Reform on Ecological Environmental Governance Ability: A Quasi-natural Experiment Based on 238 Cities in China[J]. Journal of Northeastern University(Natural Science), 2025, 46(1): 145-152.
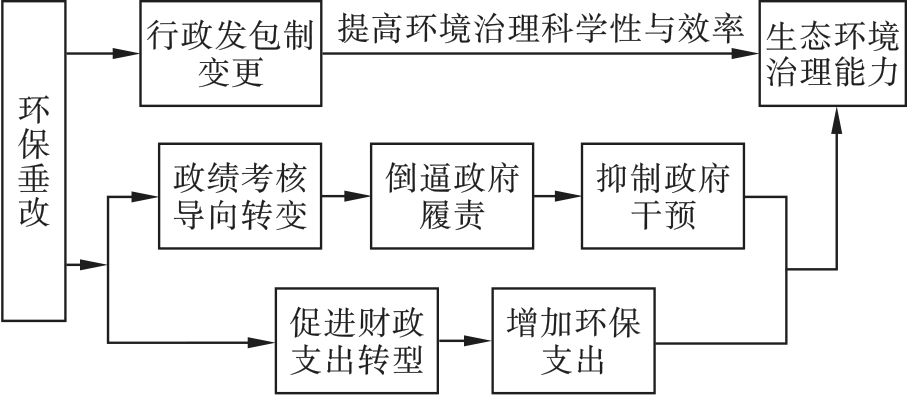
Fig.1 Impact mechanism of the environmental protection vertical management reform
| 一级指标 | 二级指标 | 指标说明 |
|---|---|---|
| 污染治理绩效 | 工业废水排放 | 工业企业生产废水与污水总量 |
| 工业烟尘排放 | 工业企业排放的烟粉尘总量 | |
| 工业SO2排放 | 工业企业排放的二氧化硫总量 | |
| 生活污水处理 | 污水处理量/污水排放总量 | |
| 固体废物处理 | 综合利用量/固体废物总量 | |
| 生活垃圾处理 | 垃圾处理量/垃圾产生量 | |
| 环境法制建设 | 政府环境信息公开 | 污染源监管信息公开指数(PITI) |
| 企业环境信息公开 | 上市公司环境信息披露(EID)指数 | |
| 环境公众参与 | 承办的人大建议和政协提案数 | |
| 区域环境立法 | 环境立法数量 | |
| 环境质量改善 | 森林覆盖率 | 森林面积/土地总面积 |
| 绿化覆盖率 | 绿化面积/建成区总面积 | |
| 水土流失治理 | 水土流失治理面积 |
Table 1 Index system of the ecological environment governance ability
| 一级指标 | 二级指标 | 指标说明 |
|---|---|---|
| 污染治理绩效 | 工业废水排放 | 工业企业生产废水与污水总量 |
| 工业烟尘排放 | 工业企业排放的烟粉尘总量 | |
| 工业SO2排放 | 工业企业排放的二氧化硫总量 | |
| 生活污水处理 | 污水处理量/污水排放总量 | |
| 固体废物处理 | 综合利用量/固体废物总量 | |
| 生活垃圾处理 | 垃圾处理量/垃圾产生量 | |
| 环境法制建设 | 政府环境信息公开 | 污染源监管信息公开指数(PITI) |
| 企业环境信息公开 | 上市公司环境信息披露(EID)指数 | |
| 环境公众参与 | 承办的人大建议和政协提案数 | |
| 区域环境立法 | 环境立法数量 | |
| 环境质量改善 | 森林覆盖率 | 森林面积/土地总面积 |
| 绿化覆盖率 | 绿化面积/建成区总面积 | |
| 水土流失治理 | 水土流失治理面积 |
| 变量 | LLC | ADF | ||
|---|---|---|---|---|
| 统计量值 | P值 | 统计量值 | P值 | |
| GOV | -12.464 5 | 0.000 0 | 17.940 6 | 0.000 0 |
| FDI | -4.985 3 | 0.000 0 | 14.789 7 | 0.000 0 |
| GDP | -2.125 9 | 0.016 8 | 5.038 0 | 0.000 0 |
| INS | -11.561 7 | 0.000 0 | 15.826 0 | 0.000 0 |
| FP | -14.637 0 | 0.000 0 | 22.029 9 | 0.000 0 |
| EDU | -46.449 4 | 0.000 0 | 56.934 9 | 0.000 0 |
| DENS | -6.011 1 | 0.000 0 | 4.845 2 | 0.000 0 |
| ER | -3.379 6 | 0.000 4 | 11.031 5 | 0.000 0 |
| ERM | -17.557 2 | 0.000 0 | 11.214 2 | 0.000 0 |
| exp | -58.997 7 | 0.000 0 | 7.338 6 | 0.000 0 |
| fiscal | -21.579 3 | 0.000 0 | 9.018 6 | 0.000 0 |
Table 2 Unit root test
| 变量 | LLC | ADF | ||
|---|---|---|---|---|
| 统计量值 | P值 | 统计量值 | P值 | |
| GOV | -12.464 5 | 0.000 0 | 17.940 6 | 0.000 0 |
| FDI | -4.985 3 | 0.000 0 | 14.789 7 | 0.000 0 |
| GDP | -2.125 9 | 0.016 8 | 5.038 0 | 0.000 0 |
| INS | -11.561 7 | 0.000 0 | 15.826 0 | 0.000 0 |
| FP | -14.637 0 | 0.000 0 | 22.029 9 | 0.000 0 |
| EDU | -46.449 4 | 0.000 0 | 56.934 9 | 0.000 0 |
| DENS | -6.011 1 | 0.000 0 | 4.845 2 | 0.000 0 |
| ER | -3.379 6 | 0.000 4 | 11.031 5 | 0.000 0 |
| ERM | -17.557 2 | 0.000 0 | 11.214 2 | 0.000 0 |
| exp | -58.997 7 | 0.000 0 | 7.338 6 | 0.000 0 |
| fiscal | -21.579 3 | 0.000 0 | 9.018 6 | 0.000 0 |
| 变量 | 系数 | t统计量 |
|---|---|---|
| EPVMR | 0.008 5** | 3.818 1 |
| FDI | -0.005 6*** | -5.384 6 |
| INS | -0.010 3** | -1.688 5 |
| GDP | 0.008 1*** | 3.595 0 |
| EDU | 0.017 7*** | 4.138 7 |
| DENS | 0.002 0*** | 3.406 7 |
| ER | -0.000 2*** | -8.398 9 |
| FP | -0.037 5*** | -3.053 8 |
| ERM | -0.000 3*** | -5.117 8 |
| 样本数 | 2 142 | |
| R2 | 0.792 7 |
Table 3 Baseline regression results
| 变量 | 系数 | t统计量 |
|---|---|---|
| EPVMR | 0.008 5** | 3.818 1 |
| FDI | -0.005 6*** | -5.384 6 |
| INS | -0.010 3** | -1.688 5 |
| GDP | 0.008 1*** | 3.595 0 |
| EDU | 0.017 7*** | 4.138 7 |
| DENS | 0.002 0*** | 3.406 7 |
| ER | -0.000 2*** | -8.398 9 |
| FP | -0.037 5*** | -3.053 8 |
| ERM | -0.000 3*** | -5.117 8 |
| 样本数 | 2 142 | |
| R2 | 0.792 7 |
| t0+k | 系数 | t统计量 |
|---|---|---|
| t0-5 | -0.010 4 | -1.419 2 |
| t0-4 | -0.008 7 | 1.120 9 |
| t0-3 | 0.004 9 | 0.609 1 |
| t0-2 | -0.055 6 | 7.137 8 |
| t0 | 0.011 9*** | 1.292 0 |
| t0+1 | 0.025 2*** | 2.768 6 |
| t0+2 | 0.028 0*** | 3.079 8 |
| 样本数 | 2 142 | |
| R2 | 0.782 6 |
Table 4 Results of the parallel trend test
| t0+k | 系数 | t统计量 |
|---|---|---|
| t0-5 | -0.010 4 | -1.419 2 |
| t0-4 | -0.008 7 | 1.120 9 |
| t0-3 | 0.004 9 | 0.609 1 |
| t0-2 | -0.055 6 | 7.137 8 |
| t0 | 0.011 9*** | 1.292 0 |
| t0+1 | 0.025 2*** | 2.768 6 |
| t0+2 | 0.028 0*** | 3.079 8 |
| 样本数 | 2 142 | |
| R2 | 0.782 6 |
| 变量 | 政策提前1年实施 | 政策提前2年实施 | ||
|---|---|---|---|---|
| 系数 | t统计量 | 系数 | t统计量 | |
| EPVMR | 0.005 0 | 0.830 9 | 0.006 9 | 1.249 5 |
| FDI | -0.006 4 | -4.909 8 | -0.000 9 | -0.642 3 |
| INS | 0.012 6 | 1.147 8 | 0.020 5* | 1.948 1 |
| GDP | -0.000 3 | 0.117 0 | -0.000 2 | -0.077 9 |
| EDU | 0.011 0 | 1.522 6 | 0.021 7*** | 3.219 8 |
| DENS | 0.003 6 | 5.543 4 | 0.001 9*** | 2.896 3 |
| ER | -0.000 2 | -9.276 5 | -0.000 1*** | -4.109 9 |
| FP | 0.022 8 | 1.218 3 | 0.007 6 | 0.424 1 |
| ERM | -0.000 3 | -4.637 5 | -0.000 1** | -2.290 0 |
| 样本数 | 1 904 | 1 666 | ||
| R2 | 0.827 4 | 0.754 4 | ||
Table 5 Counter-fact test
| 变量 | 政策提前1年实施 | 政策提前2年实施 | ||
|---|---|---|---|---|
| 系数 | t统计量 | 系数 | t统计量 | |
| EPVMR | 0.005 0 | 0.830 9 | 0.006 9 | 1.249 5 |
| FDI | -0.006 4 | -4.909 8 | -0.000 9 | -0.642 3 |
| INS | 0.012 6 | 1.147 8 | 0.020 5* | 1.948 1 |
| GDP | -0.000 3 | 0.117 0 | -0.000 2 | -0.077 9 |
| EDU | 0.011 0 | 1.522 6 | 0.021 7*** | 3.219 8 |
| DENS | 0.003 6 | 5.543 4 | 0.001 9*** | 2.896 3 |
| ER | -0.000 2 | -9.276 5 | -0.000 1*** | -4.109 9 |
| FP | 0.022 8 | 1.218 3 | 0.007 6 | 0.424 1 |
| ERM | -0.000 3 | -4.637 5 | -0.000 1** | -2.290 0 |
| 样本数 | 1 904 | 1 666 | ||
| R2 | 0.827 4 | 0.754 4 | ||
| 变量 | 模型1 | 模型2 | 模型3 | 模型4 |
|---|---|---|---|---|
| EPVMR | -0.065 7** (-2.264 5) | 0.007 3** (1.385 7) | 8.107 0*** (4.476 8) | 0.007 7*** (1.278 5) |
| fiscal | — | -0.002 9** (-0.555 0) | — | — |
| exp | — | — | — | 0.002 0*** (1.070 2) |
| FDI | -0.008 2 (-1.508 9) | -0.005 7*** (-5.415 5) | 1.475 7*** (4.611 0) | -0.005 8*** (-5.471 3) |
| INS | 0.000 3 (0.009 3) | -0.010 6*** (-1.712 0) | -6.406 6*** (-3.278 4) | -0.009 7 (-1.568 9) |
| GDP | 0.033 3*** (2.661 8) | 0.008 1*** (3.616 0) | 5.090 4*** (7.113 2) | 0.007 5*** (3.277 0) |
| EDU | 0.022 5 (0.643 5) | 0.017 7*** (4.162 7) | 13.691 6*** (9.134 2) | 0.016 6*** (3.785 0) |
| DENS | 0.008 2*** (2.725 6) | 0.002 0*** (3.414 9) | -1.489 1*** (-8.585 0) | 0.002 1*** (3.498 8) |
| ER | 0.000 5*** (5.647 1) | 0.000 2*** (8.430 2) | 0.005 9 (1.161 5) | 0.000 1*** (8.290 5) |
| FP | -0.094 2 (-1.035 0) | -0.037 0*** (-3.007 0) | -2.181 8 (-0.537 5) | -0.037 1*** (-2.997 3) |
| ERM | 0.000 2 (5.480 9) | 0.000 3*** (5.123 9) | 0.044 4** (2.298 1) | 0.000 3*** (5.003 0) |
| 样本数 | 2 142 | 2 142 | 2 142 | 2 142 |
| R2 | 0.366 4 | 0.819 5 | 0.214 8 | 0.819 4 |
Table 6 Regression results of the mediating effect
| 变量 | 模型1 | 模型2 | 模型3 | 模型4 |
|---|---|---|---|---|
| EPVMR | -0.065 7** (-2.264 5) | 0.007 3** (1.385 7) | 8.107 0*** (4.476 8) | 0.007 7*** (1.278 5) |
| fiscal | — | -0.002 9** (-0.555 0) | — | — |
| exp | — | — | — | 0.002 0*** (1.070 2) |
| FDI | -0.008 2 (-1.508 9) | -0.005 7*** (-5.415 5) | 1.475 7*** (4.611 0) | -0.005 8*** (-5.471 3) |
| INS | 0.000 3 (0.009 3) | -0.010 6*** (-1.712 0) | -6.406 6*** (-3.278 4) | -0.009 7 (-1.568 9) |
| GDP | 0.033 3*** (2.661 8) | 0.008 1*** (3.616 0) | 5.090 4*** (7.113 2) | 0.007 5*** (3.277 0) |
| EDU | 0.022 5 (0.643 5) | 0.017 7*** (4.162 7) | 13.691 6*** (9.134 2) | 0.016 6*** (3.785 0) |
| DENS | 0.008 2*** (2.725 6) | 0.002 0*** (3.414 9) | -1.489 1*** (-8.585 0) | 0.002 1*** (3.498 8) |
| ER | 0.000 5*** (5.647 1) | 0.000 2*** (8.430 2) | 0.005 9 (1.161 5) | 0.000 1*** (8.290 5) |
| FP | -0.094 2 (-1.035 0) | -0.037 0*** (-3.007 0) | -2.181 8 (-0.537 5) | -0.037 1*** (-2.997 3) |
| ERM | 0.000 2 (5.480 9) | 0.000 3*** (5.123 9) | 0.044 4** (2.298 1) | 0.000 3*** (5.003 0) |
| 样本数 | 2 142 | 2 142 | 2 142 | 2 142 |
| R2 | 0.366 4 | 0.819 5 | 0.214 8 | 0.819 4 |
| 变量 | 区域异质性 | 约束力异质性 | ||
|---|---|---|---|---|
| 东部地区 | 中西部地区 | 省会城市 | 非省会城市 | |
| EPVMR | 0.001 6* (0.249 9) | -0.063 0 (-1.859 0) | 0.007 4*** (4.369 1) | 0.000 8 (0.127 7) |
| FDI | -0.014 1*** (-9.697 7) | 0.000 5 (0.275 8) | -0.004 1 (-1.090 3) | -0.005 8 (-5.404 2) |
| INS | -0.006 9 (-0.900 9) | 0.015 6 (1.053 5) | 0.042 5 (1.502 6) | -0.014 6 (-2.334 2) |
| GDP | -0.000 4 (-0.108 0) | -0.001 8 (-0.477 6) | 0.018 7* (1.673 2) | 0.003 0 (1.281 9) |
| EDU | 0.031 0** (2.454 6) | 0.002 5 (0.249 8) | 0.017 5* (1.689 0) | 0.026 5 (5.958 3) |
| DENS | 0.002 1*** (2.640 4) | 0.002 4 (2.198 8) | 0.005 3*** (2.967 8) | 0.002 5 (4.222 9) |
| ER | -0.000 1*** (-5.114 1) | -0.000 9 (-7.504 7) | -0.000 1** (-2.344 2) | -0.000 2 (-12.174 4) |
| FP | -0.031 6 (-1.135 6) | 0.037 3 (1.369 6) | 0.083 0** (2.041 9) | -0.049 7 (-4.111 0) |
| ERM | -0.000 4*** (-4.699 4) | -0.000 4 (-3.357 9) | -0.000 3* (-1.903 3) | -0.000 3 (-3.750 3) |
| 样本数 | 1 062 | 1 080 | 252 | 1 890 |
| R2 | 0.813 2 | 0.808 1 | 0.834 5 | 0.792 3 |
Table 7 Regional heterogeneity and constraint
| 变量 | 区域异质性 | 约束力异质性 | ||
|---|---|---|---|---|
| 东部地区 | 中西部地区 | 省会城市 | 非省会城市 | |
| EPVMR | 0.001 6* (0.249 9) | -0.063 0 (-1.859 0) | 0.007 4*** (4.369 1) | 0.000 8 (0.127 7) |
| FDI | -0.014 1*** (-9.697 7) | 0.000 5 (0.275 8) | -0.004 1 (-1.090 3) | -0.005 8 (-5.404 2) |
| INS | -0.006 9 (-0.900 9) | 0.015 6 (1.053 5) | 0.042 5 (1.502 6) | -0.014 6 (-2.334 2) |
| GDP | -0.000 4 (-0.108 0) | -0.001 8 (-0.477 6) | 0.018 7* (1.673 2) | 0.003 0 (1.281 9) |
| EDU | 0.031 0** (2.454 6) | 0.002 5 (0.249 8) | 0.017 5* (1.689 0) | 0.026 5 (5.958 3) |
| DENS | 0.002 1*** (2.640 4) | 0.002 4 (2.198 8) | 0.005 3*** (2.967 8) | 0.002 5 (4.222 9) |
| ER | -0.000 1*** (-5.114 1) | -0.000 9 (-7.504 7) | -0.000 1** (-2.344 2) | -0.000 2 (-12.174 4) |
| FP | -0.031 6 (-1.135 6) | 0.037 3 (1.369 6) | 0.083 0** (2.041 9) | -0.049 7 (-4.111 0) |
| ERM | -0.000 4*** (-4.699 4) | -0.000 4 (-3.357 9) | -0.000 3* (-1.903 3) | -0.000 3 (-3.750 3) |
| 样本数 | 1 062 | 1 080 | 252 | 1 890 |
| R2 | 0.813 2 | 0.808 1 | 0.834 5 | 0.792 3 |
| 1 | Zhang B, Cao C, Gu J Z,et al.A new environmental protection law,many old problems? challenges to environmental governance in China[J].Journal of Environmental Law,2016,28(2):325-335. |
| 2 | Zhang N, Deng J Q, Ahmad F,et al.Local government competition and regional green development in China:the mediating role of environmental regulation[J].International Journal of Environmental Research and Public Health,2020,17(10):3485. |
| 3 | 孔凡斌,王苓,徐彩瑶,等.中国生态环境治理体系和治理能力现代化:理论解析、实践评价与研究展望[J].管理学刊,2022,35(5):50-64. |
| Kong Fan‑bin, Wang Ling, Xu Cai‑yao,et al.Modernization of China’ s ecological and environment governance system and governance capacity:theoretical analysis,practical evaluation and research prospect[J].Journal of Management,2022,35(5):50-64. | |
| 4 | 邱实,杨爽.属地管理扩张下的基层治理困境及优化研究[J].河海大学学报(哲学社会科学版),2022,24(6):59-67,130-131. |
| Qiu Shi, Yang Shuang.Dilemma and optimization of grass‑roots governance under territorial management expansion[J].Journal of Hohai University(Philosophy and Social Sciences),2022,24(6):59-67,130-131. | |
| 5 | Fan C S, Lin C, Treisman D.Political decentralization and corruption:evidence from around the world[J].Journal of Public Economics,2009,93(1/2):14-34. |
| 6 | 张彩云,夏勇.“条块关系”变化能够改善环境质量吗——基于“环保垂改”的讨论[J].山西财经大学学报,2021,43(10):29-42. |
| Zhang Cai‑yun, Xia Yong.Can the change of “Tiao‑Kuai relation” improve environmental quality:discussion based on “environmental protection vertical reform”[J].Journal of Shanxi University of Finance and Economics,2021,43(10):29-42. | |
| 7 | 韩超,孙晓琳,李静.环境规制垂直管理改革的减排效应:来自地级市环保系统改革的证据[J].经济学(季刊),2021,21(1):335-360. |
| Han Chao, Sun Xiao‑lin, Li Jing.Emission reduction effect of vertical management reform in environmental regulation:evidence from environmental system reform in cities[J].China Economic Quarterly,2021,21(1):335-360. | |
| 8 | Han C, Sun X L, Tian X L.Environmental centralizing and firm productivity:evidence from China’ s vertical environmental reforms[J].Land Economics,2021,97(4):723-744. |
| 9 | Koh J Y, Room H Y.A study of evaluation indicators on local environmental governance[J].Korean Social and Administrative Studies,2008,19(1):113-140. |
| 10 | 刘险,朱章林,刘哲,等.湖北省环境治理能力评价与影响因素研究[J].环境科学与技术,2022,45(5):226-236. |
| Liu Xian, Zhu Zhang-lin, Liu Zhe,et al.Evaluation and research on influencing factors of environmental governance capacity of Hubei Province[J].Environmental Science & Technology,2022,45(5):226-236. | |
| 11 | 郭进,兰叶凡.省际环境治理能力现代化水平的测度与评价[J].统计与决策,2023,39(2):47-52. |
| Guo Jin, Lan Ye-fan.Measure and evaluation of modernization level of interprovincial environmental governance ability[J].Statistics & Decision,2023,39(2):47-52. | |
| 12 | Koch L, Gorris P, Pahl‑Wostl C.Narratives,narrations and social structure in environmental governance[J].Global Environmental Change,2021,69:102317. |
| 13 | van der Molen F.How knowledge enables governance:the coproduction of environmental governance capacity[J].Environmental Science & Policy,2018,87:18-25. |
| 14 | Gu Z J, Tian C W, Zheng Z Y,et al.Favorable fiscal self‑sufficiency enables local governments to better improve the environmental governance:evidence from China’s lower‑pollution areas[J].Sustainability,2022,14( 23 ):16202. |
| 15 | Rochlitz M, Kulpina V, Remington T,et al.Performance incentives and economic growth:regional officials in Russia and China[J].Eurasian Geography and Economics,2015,56(4):421-445. |
| 16 | Ran R.Perverse incentive structure and policy implementation gap in China’s local environmental politics[J].Journal of Environmental Policy & Planning,2013,15(1):17-39. |
| 17 | Beck T, Levine R, Levkov A.Big bad banks?the winners and losers from bank deregulation in the United States[J].The Journal of Finance,2010,65(5):1637-1667. |
| 18 | 彭铭刚.环境垂直管理体制对改善空气质量的因果效应评估[J].统计与决策,2018,34(22):56-60. |
| Peng Ming‑gang.Causal effect evaluation of environmental vertical management system on improving air quality[J].Statistics & Decision,2018,34(22):56-60. | |
| 19 | Han Y, Kou P, Jiao Y.How does public participation in environmental protection affect air pollution in China? a perspective of local government intervention[J].Polish Journal of Environmental Studies,2022,31(2):1095-1107. |
| 20 | Jacobson L S, LaLonde R J, Sullivan D G.Earnings losses of displaced workers[J].American Economic Review,1993,83(4):685-709. |
| No related articles found! |
| Viewed | ||||||
|
Full text |
|
|||||
|
Abstract |
|
|||||