Journal of Northeastern University(Natural Science) ›› 2024, Vol. 45 ›› Issue (3): 449-456.DOI: 10.12068/j.issn.1005-3026.2024.03.018
• Management Science • Previous Articles
Shu-xi TIAN( ), Xiu-yu DING, Jian WANG
Received:2022-10-21
Online:2024-03-15
Published:2024-05-17
Contact:
Shu-xi TIAN
About author:TIAN Shu-xi, E-mail: sxtian@ mail.neu.edu.cnCLC Number:
Shu-xi TIAN, Xiu-yu DING, Jian WANG. Spatial Spillover Effect of Positive Feedback Trading in Stock Markets: Based on Econometric Test Under the Shock of COVID-19 Pandemic[J]. Journal of Northeastern University(Natural Science), 2024, 45(3): 449-456.
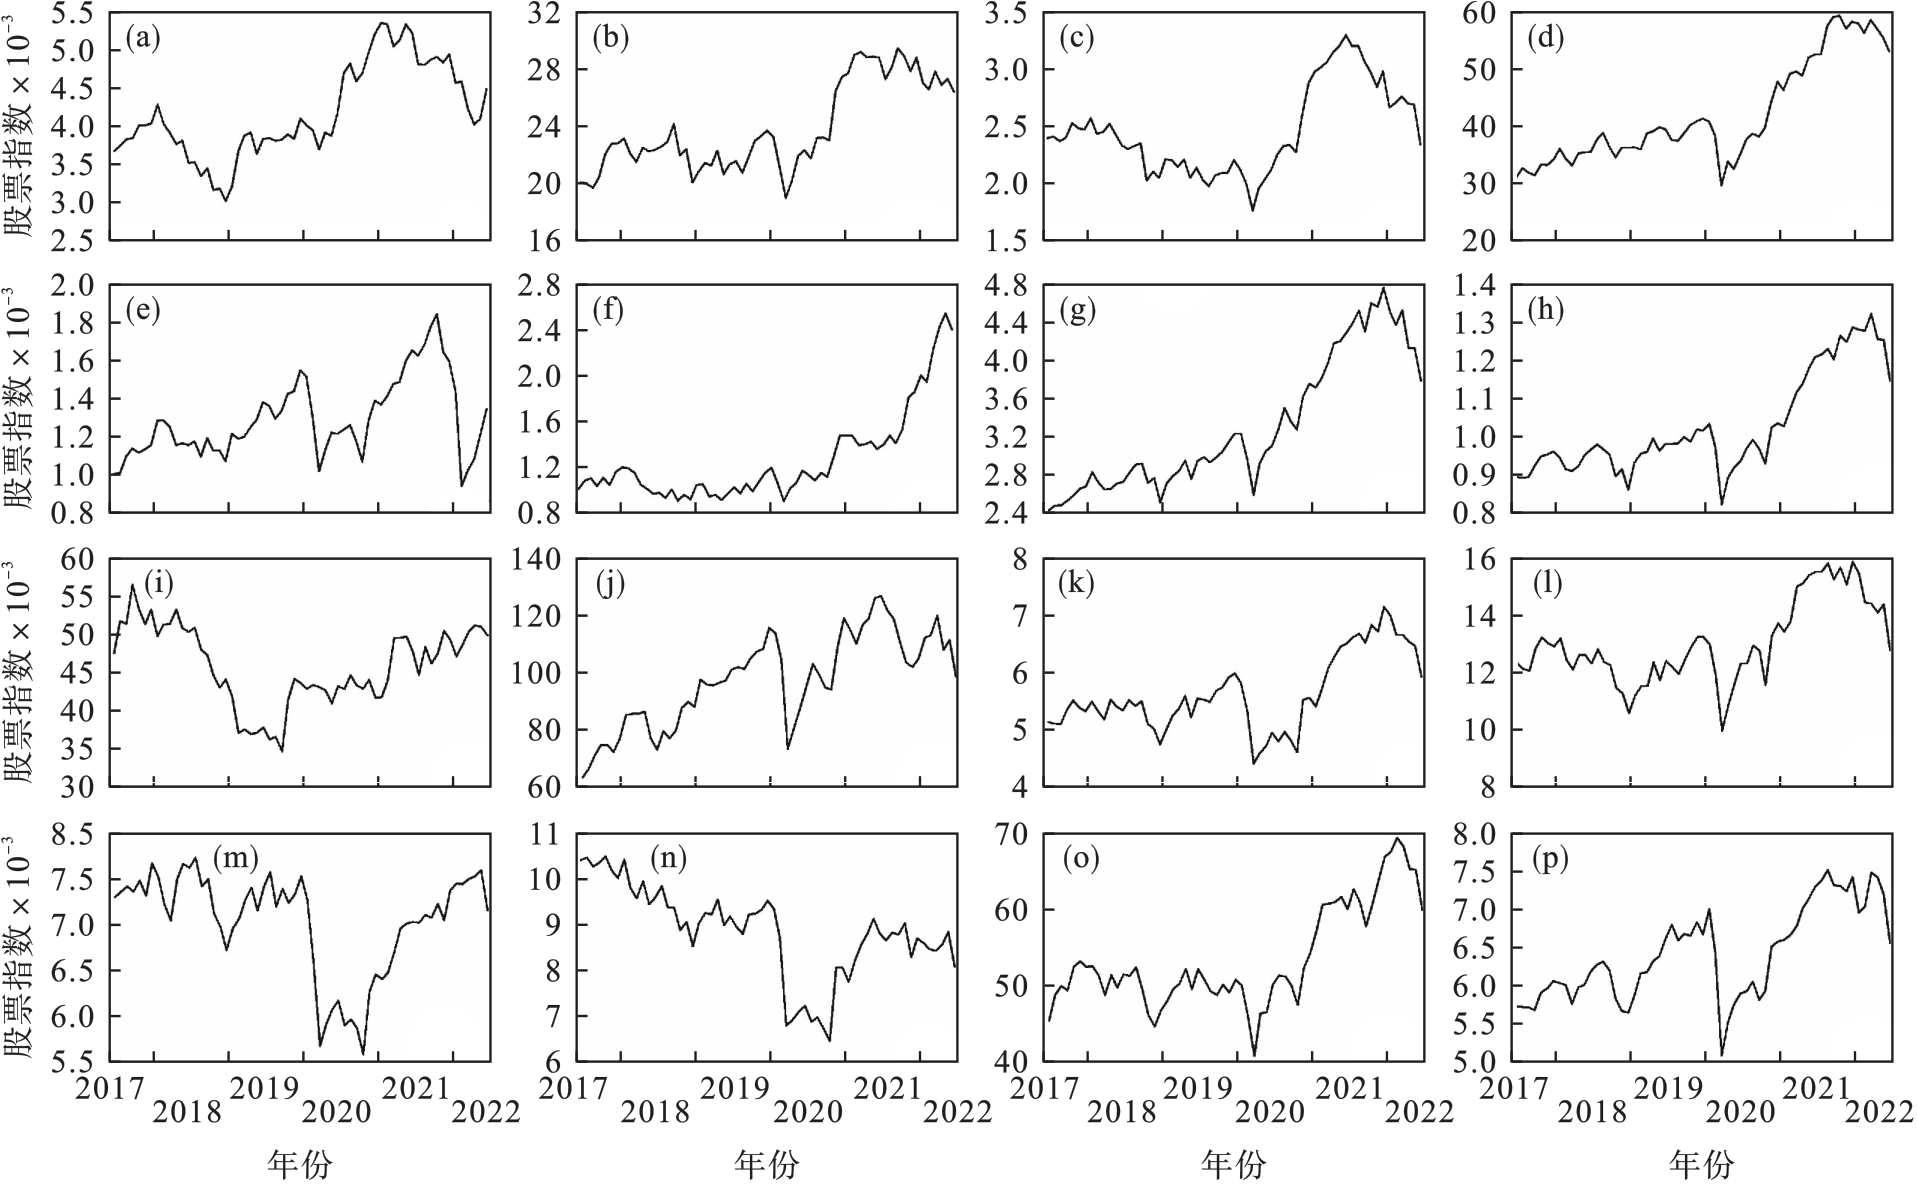
Fig.1 Trend of representative stock indices in relevant countries
| 股票指数 | CSI300 | Nikkei225 | KOSPI200 | Sensex30 | RTS50 | ISE100 | SP500 | SPTSX60 |
|---|---|---|---|---|---|---|---|---|
| 疫情前 | 306.4 | 1129.03 | 191.1 | 123.11 | 38.7 | 2035.65 | 2730.86 | 84.14 |
| 疫情期 | 492.81 | 3116.97 | 606.65 | 241.52 | 114.46 | 7862.71 | 9932.62 | 451.42 |
| 股票指数 | IPC34 | Bovespa74 | CAC40 | DAX30 | FTSE100 | IBEX35 | TOP40 | ASX20 |
| 疫情前 | 13029 | 678.99 | 238.89 | 179.46 | 545.93 | 268.53 | 3289.87 | 367.63 |
| 疫情期 | 12858.23 | 1632.71 | 627.04 | 446.83 | 846.18 | 848.58 | 6615.76 | 678.45 |
Table 1 Standard deviation of representative stock indices in relevant countries
| 股票指数 | CSI300 | Nikkei225 | KOSPI200 | Sensex30 | RTS50 | ISE100 | SP500 | SPTSX60 |
|---|---|---|---|---|---|---|---|---|
| 疫情前 | 306.4 | 1129.03 | 191.1 | 123.11 | 38.7 | 2035.65 | 2730.86 | 84.14 |
| 疫情期 | 492.81 | 3116.97 | 606.65 | 241.52 | 114.46 | 7862.71 | 9932.62 | 451.42 |
| 股票指数 | IPC34 | Bovespa74 | CAC40 | DAX30 | FTSE100 | IBEX35 | TOP40 | ASX20 |
| 疫情前 | 13029 | 678.99 | 238.89 | 179.46 | 545.93 | 268.53 | 3289.87 | 367.63 |
| 疫情期 | 12858.23 | 1632.71 | 627.04 | 446.83 | 846.18 | 848.58 | 6615.76 | 678.45 |
| 股票指数 | CSI300 | Nikkei225 | KOSPI200 | Sensex30 | RTS50 | ISE100 | SP500 | SPTSX60 |
|---|---|---|---|---|---|---|---|---|
| 疫情前 | -0.7431 | -0.1977 | 0.3218 | 0.7642 | 0.3188 | -0.7128 | 0.0073 | 0.4178 |
| 疫情期 | -0.3262 | -0.7278 | -0.3347 | 0.1374 | -0.2086 | -0.2871 | -0.4012 | -0.3433 |
| 股票指数 | IPC34 | Bovespa74 | CAC40 | DAX30 | FTSE100 | IBEX35 | TOP40 | ASX20 |
| 疫情前 | 0.2154 | -0.5535 | -0.5655 | 0.0437 | 0.3216 | 0.0232 | 0.2423 | 0.3529 |
| 疫情期 | -0.7497 | -0.5139 | -0.3337 | -0.3294 | -0.6467 | -0.2980 | -0.2662 | -0.6581 |
Table 2 Skewness of representative stock indices in relevant countries
| 股票指数 | CSI300 | Nikkei225 | KOSPI200 | Sensex30 | RTS50 | ISE100 | SP500 | SPTSX60 |
|---|---|---|---|---|---|---|---|---|
| 疫情前 | -0.7431 | -0.1977 | 0.3218 | 0.7642 | 0.3188 | -0.7128 | 0.0073 | 0.4178 |
| 疫情期 | -0.3262 | -0.7278 | -0.3347 | 0.1374 | -0.2086 | -0.2871 | -0.4012 | -0.3433 |
| 股票指数 | IPC34 | Bovespa74 | CAC40 | DAX30 | FTSE100 | IBEX35 | TOP40 | ASX20 |
| 疫情前 | 0.2154 | -0.5535 | -0.5655 | 0.0437 | 0.3216 | 0.0232 | 0.2423 | 0.3529 |
| 疫情期 | -0.7497 | -0.5139 | -0.3337 | -0.3294 | -0.6467 | -0.2980 | -0.2662 | -0.6581 |
| 时间 | |||
|---|---|---|---|
| 疫情前 | 0.067 1(0.238 9) | -0.128 9(0.056 6***) | -0.082 3(0.164 2) |
| 疫情后 | 0.217 6(0.033 5***) | -0.293 5(0.074 1***) | -0.179 6(0.075 8**) |
Table 3 Econometric test of positive feedback trading according to spatial geographical correlation
| 时间 | |||
|---|---|---|---|
| 疫情前 | 0.067 1(0.238 9) | -0.128 9(0.056 6***) | -0.082 3(0.164 2) |
| 疫情后 | 0.217 6(0.033 5***) | -0.293 5(0.074 1***) | -0.179 6(0.075 8**) |
| 时间 | ||||||
|---|---|---|---|---|---|---|
| 疫情前 | 0.009 1 (0.284 3) | 0.005 2 (0.448 8) | -0.100 9 (0.028 7***) | -0.073 3 (0.022 4***) | -0.131 6 (0.037 7***) | -0.051 2 (0.023 2**) |
| 疫情后 | -0.112 7 (0.053 0*) | -0.083 5 (0.134 9) | -0.184 5 (0.075 0**) | -0.323 1 (0.009 8***) | -0.250 8 (0.004 5***) | -0.130 5 (0.003 6***) |
Table 4 Econometric test of positive feedback trading according to spatial economic correlation
| 时间 | ||||||
|---|---|---|---|---|---|---|
| 疫情前 | 0.009 1 (0.284 3) | 0.005 2 (0.448 8) | -0.100 9 (0.028 7***) | -0.073 3 (0.022 4***) | -0.131 6 (0.037 7***) | -0.051 2 (0.023 2**) |
| 疫情后 | -0.112 7 (0.053 0*) | -0.083 5 (0.134 9) | -0.184 5 (0.075 0**) | -0.323 1 (0.009 8***) | -0.250 8 (0.004 5***) | -0.130 5 (0.003 6***) |
| 时期 | ||||||
|---|---|---|---|---|---|---|
| “量化宽松”时期 | 0.032 2 (0.192 5) | 0.007 4 (0.120 3) | -0.150 8 (0.042 5***) | -0.126 8 (0.031 2***) | -0.154 1 (0.067 8**) | -0.271 6 (0.033 2***) |
| “加息缩表”时期 | -0.026 3 (0.098 6) | 0.030 9 (0.057 3) | -0.260 3 (0.036 9***) | -0.244 9 (0.007 7***) | -0.102 3 (0.003 6***) | -0.096 4 (0.040 1**) |
Table 5 Robust test of spatial spillover effect of positive feedback trading
| 时期 | ||||||
|---|---|---|---|---|---|---|
| “量化宽松”时期 | 0.032 2 (0.192 5) | 0.007 4 (0.120 3) | -0.150 8 (0.042 5***) | -0.126 8 (0.031 2***) | -0.154 1 (0.067 8**) | -0.271 6 (0.033 2***) |
| “加息缩表”时期 | -0.026 3 (0.098 6) | 0.030 9 (0.057 3) | -0.260 3 (0.036 9***) | -0.244 9 (0.007 7***) | -0.102 3 (0.003 6***) | -0.096 4 (0.040 1**) |
| 1 | Sentana E, Wadhwani S.Feedback traders and stock return autocorrelations:evidence from a century of daily data[J].Economic Journal,1992,102:415-425. |
| 2 | Koutmos G, Saidi R.Positive feedback trading in emerging capital markets[J].Applied Financial Economics,2001,11(3):291-297. |
| 3 | Koutmos G.Positive feedback trading:a review[J].Review of Behavioral Finance,2014,6(2):155-162. |
| 4 | Schauten M B J, Willemstein R, Zwinkels R C J.A tale of feedback trading by hedge funds[J].Journal of Empirical Finance,2015,34:239-259. |
| 5 | Frijns B, Gilbert A, Zwinkels R C J.On the style‑based feedback trading of mutual fund managers[J].Journal of Financial and Quantitative Analysis,2016,51(3):771-800. |
| 6 | Kallinterakis V, Liu F, Pantelous A A,et al.Pricing inefficiencies and feedback trading:evidence from country ETFs[J].International Review of Financial Analysis,2020,70:101498. |
| 7 | 朱光伟,蒋军,王擎.信用账户杠杆、投资者行为与股市稳定[J].经济研究,2020,55(2):84-100. |
| Zhu Guang‐wei, Jiang Jun, Wang Qing.Margin account leverage,investor behavior and stock market stability[J].Economic Research Journal,2020,55(2):84-100. | |
| 8 | Cheung W F, Tsai S H.Global capital market interdependence and spillover effect of credit risk:evidence from the 2007—2009 global financial crisis[J].Applied Financial Economics,2010,20:85-103. |
| 9 | Fernández‑Avilés G, Montero J M, Orlov A G.Spatial modeling of stock market comovements[J].Finance Research Letters,2012,9(4):202-212. |
| 10 | Asgharian H, Hess W, Liu L.A spatial analysis of international stock market linkages[J].Journal of Banking & Finance,2013,37(12):4738-4754. |
| 11 | Ichev R, Marinč M.Stock prices and geographic proximity of information:evidence from the Ebola outbreak[J].International Review of Financial Analysis,2018,56:153-166. |
| 12 | Ali M, Alam N, Rizvi S A R.Coronavirus (COVID-19)—an epidemic or pandemic for financial markets[J].Journal of Behavioral and Experimental Finance,2020,27:100341. |
| 13 | Jiang S W, Jin X.Effects of investor sentiment on stock return volatility:a spatio‐temporal dynamic panel model[J].Economic Modelling,2021,97:298-306. |
| 14 | 宋玉臣,吕静茹.突发事件冲击下的中外股票市场联动性与风险溢出效应[J].数量经济研究,2022,13(1):15-33. |
| Song Yu‐chen, Jing‐ru Lyu.The co‐movement and risk spillover effects of Chinese and foreign stock markets under the impact of sudden events[J].The Journal of Quantitative Economics,2022,13(1):15-33. | |
| 15 | Anselin L.Spatial econometrics:methods and models[M].Dordrecht:Springer,1988. |
| 16 | Coval J D, Moskowitz T J.Home bias at home:local equity preference in domestic portfolios[J].The Journal of Finance,1999,54(6):2045-2073. |
| 17 | Bollerslev T, Chou R Y, Kroner K F.ARCH modeling in finance: a review of the theory and empirical evidence[J].Journal of Econometrics,1992,52(1/2):5-59. |
| [1] | YU Jin-ming, JIN Xiu, LIU Yue-li. Cross-Industry Risk Contagion Effect in China’s Stock Market During Crises [J]. Journal of Northeastern University(Natural Science), 2023, 44(6): 898-906. |
| [2] | JIN Xiu, HOU Yu-ting. Research on Relationship Between Information Efficiency and Liquidity Premium [J]. Journal of Northeastern University(Natural Science), 2023, 44(5): 735-742. |
| [3] | MA Yuan-yuan, LIU Yan-ze, LIU Cheng-long, ZHANG Tian-jie. Chinese Investors’ Multi-perspective Sentiment Analysis and Its Role in Stock Market Forecasting [J]. Journal of Northeastern University(Natural Science), 2022, 43(8): 1201-1209. |
| [4] | XIAO Ming, GUO Ying, ZHU Jia-hui. Analysis of Macroeconomic Motivations of Cross-Border Mergers and Acquisitions in China Based on EEMD Model [J]. Journal of Northeastern University(Natural Science), 2022, 43(4): 599-608. |
| [5] | HUANG Wei-qiang, ZHAO Yang, YAO Shuang. Tail Risk Spillover Effect Between Oil Market and Stock Market:Based on Variational Mode Decomposition and Dynamic Copula Function [J]. Journal of Northeastern University(Natural Science), 2021, 42(8): 1186-1193. |
| [6] | TIAN Shu-xi, HU Jing-xue, SUN Ying, WANG Jian. Influence of Stock Index Futures on Positive Feedback Trading in the Stock Market: An Econometric Test in China’s A-Share Market [J]. Journal of Northeastern University Natural Science, 2020, 41(12): 1794-1799. |
| [7] | LI Yan-shuang, ZHUANG Xin-tian, WANG Jian, ZHANG Wei-ping. Analysis of Community Structures and Systemic Risks in China’s Stock Market Under Extreme Conditions [J]. Journal of Northeastern University Natural Science, 2020, 41(10): 1500-1508. |
| [8] | SHI Jian-hua, HAN Ying, KOU Po. Analysis on the Direct Rebound Effect of Urban Residents′ Electricity Consumption—Considering Local and Global Spatial Spillover Effects [J]. Journal of Northeastern University Natural Science, 2019, 40(12): 1800-1804. |
| [9] | ZHANG Wei-ping, ZHUANG Xin-tian, LI Yan-shuang. Network Topology Struture of China Stock Market Under Extreme Volatility of Stock Indexes [J]. Journal of Northeastern University Natural Science, 2018, 39(10): 1511-1515. |
| [10] | ZHUANG Xiao-wei, JIN Xiu. Correlation Between Network Topological Index and Volatility of Shanghai Stock Market [J]. Journal of Northeastern University Natural Science, 2015, 36(3): 453-456. |
| [11] | HUANG Weiqiang, ZHUANG Xintian, YAO Shuang. Network Modeling and Empirical Study of Information Spillover Among Industries of Chinese Stock Market [J]. Journal of Northeastern University Natural Science, 2014, 35(1): 135-138. |
| Viewed | ||||||
|
Full text |
|
|||||
|
Abstract |
|
|||||