Journal of Northeastern University(Natural Science) ›› 2025, Vol. 46 ›› Issue (4): 115-123.DOI: 10.12068/j.issn.1005-3026.2025.20230287
• Resources & Civil Engineering • Previous Articles
Xi-jing QI, Meng-xing ZHANG, Sheng-jin ZHANG
Received:2023-10-11
Online:2025-04-15
Published:2025-07-01
CLC Number:
Xi-jing QI, Meng-xing ZHANG, Sheng-jin ZHANG. Evaluation and Optimization of Green Development Efficiency of Construction Industry in China[J]. Journal of Northeastern University(Natural Science), 2025, 46(4): 115-123.
| 指标类型 | 一级指标 | 二级指标 |
|---|---|---|
| 投入 | 人员投入 | 建筑业从业人员数 |
| 材料投入 | 建筑业钢材、水泥、木材、玻璃、铝材消耗量等 | |
| 机械投入 | 年末自有施工机械设备总功率、年末自有施工机械设备台数等 | |
| 期望产出 | 实物产出 | 房屋竣工面积、房屋施工面积、房屋新开工面积等 |
| 经济效益 | 建筑业总产值、建筑业利税总额、建筑业利润总额、建筑业税金总额等 | |
| 非期望产出 | 污染强度 | 建筑业CO2排放量 |
Table 1 Preliminary selection of evaluation indicators
| 指标类型 | 一级指标 | 二级指标 |
|---|---|---|
| 投入 | 人员投入 | 建筑业从业人员数 |
| 材料投入 | 建筑业钢材、水泥、木材、玻璃、铝材消耗量等 | |
| 机械投入 | 年末自有施工机械设备总功率、年末自有施工机械设备台数等 | |
| 期望产出 | 实物产出 | 房屋竣工面积、房屋施工面积、房屋新开工面积等 |
| 经济效益 | 建筑业总产值、建筑业利税总额、建筑业利润总额、建筑业税金总额等 | |
| 非期望产出 | 污染强度 | 建筑业CO2排放量 |
| 指标类型 | 一级指标 | 二级指标 |
|---|---|---|
| 投入 | 人员投入 | X1建筑业从业人员数 |
| 材料投入 | X2建筑业钢材和水泥消耗总量 | |
| 机械投入 | X3年末自有施工机械设备总功率 | |
| 资金投入 | X4建筑业固定资产投资额 | |
| 技术投入 | X5科学技术支出占公共预算支出的比重 | |
| 期望产出 | 实物产出 | Y1房屋竣工面积 |
| 经济效益 | Y2建筑业总产值 | |
| 社会效益 | Y3常住人口城镇化率 | |
| 非期望产出 | 污染强度 | Z1建筑业CO2排放量 |
Table 2 Selection and interpretation of evaluation indicators
| 指标类型 | 一级指标 | 二级指标 |
|---|---|---|
| 投入 | 人员投入 | X1建筑业从业人员数 |
| 材料投入 | X2建筑业钢材和水泥消耗总量 | |
| 机械投入 | X3年末自有施工机械设备总功率 | |
| 资金投入 | X4建筑业固定资产投资额 | |
| 技术投入 | X5科学技术支出占公共预算支出的比重 | |
| 期望产出 | 实物产出 | Y1房屋竣工面积 |
| 经济效益 | Y2建筑业总产值 | |
| 社会效益 | Y3常住人口城镇化率 | |
| 非期望产出 | 污染强度 | Z1建筑业CO2排放量 |
| 指标 | X1 | X2 | X3 | X4 | X5 | Y1 | Y2 | Y3 | Z1 |
|---|---|---|---|---|---|---|---|---|---|
| X1 | 1 | 0.578* | 0.795** | 0.924** | 0.591* | 0.887** | 0.969** | 0.957** | 0.932** |
| X2 | 0.578* | 1 | 0.668* | 0.544* | 0.543* | 0.696* | 0.614* | 0.557* | 0.723* |
| X3 | 0.795** | 0.668* | 1 | 0.617* | 0.352 | 0.905** | 0.789** | 0.687** | 0.812** |
| X4 | 0.924** | 0.544* | 0.617* | 1 | 0.658* | 0.749** | 0.940** | 0.985** | 0.917* |
| X5 | 0.591* | 0.543* | 0.352 | 0.658* | 1 | 0.576* | 0.535* | 0.610* | 0.554* |
| Y1 | 0.887** | 0.696* | 0.905** | 0.749** | 0.576* | 1 | 0.902** | 0.816** | 0.913** |
| Y2 | 0.969** | 0.614* | 0.789** | 0.940** | 0.535* | 0.902** | 1 | 0.967** | 0.924** |
| Y3 | 0.957** | 0.557* | 0.687** | 0.985** | 0.610* | 0.816** | 0.967** | 1 | 0.917* |
| Z1 | 0.932** | 0.723* | 0.812** | 0.917* | 0.554* | 0.913** | 0.924** | 0.917* | 1 |
Table 3 Correlation coefficient of Pearson between input and output variables
| 指标 | X1 | X2 | X3 | X4 | X5 | Y1 | Y2 | Y3 | Z1 |
|---|---|---|---|---|---|---|---|---|---|
| X1 | 1 | 0.578* | 0.795** | 0.924** | 0.591* | 0.887** | 0.969** | 0.957** | 0.932** |
| X2 | 0.578* | 1 | 0.668* | 0.544* | 0.543* | 0.696* | 0.614* | 0.557* | 0.723* |
| X3 | 0.795** | 0.668* | 1 | 0.617* | 0.352 | 0.905** | 0.789** | 0.687** | 0.812** |
| X4 | 0.924** | 0.544* | 0.617* | 1 | 0.658* | 0.749** | 0.940** | 0.985** | 0.917* |
| X5 | 0.591* | 0.543* | 0.352 | 0.658* | 1 | 0.576* | 0.535* | 0.610* | 0.554* |
| Y1 | 0.887** | 0.696* | 0.905** | 0.749** | 0.576* | 1 | 0.902** | 0.816** | 0.913** |
| Y2 | 0.969** | 0.614* | 0.789** | 0.940** | 0.535* | 0.902** | 1 | 0.967** | 0.924** |
| Y3 | 0.957** | 0.557* | 0.687** | 0.985** | 0.610* | 0.816** | 0.967** | 1 | 0.917* |
| Z1 | 0.932** | 0.723* | 0.812** | 0.917* | 0.554* | 0.913** | 0.924** | 0.917* | 1 |
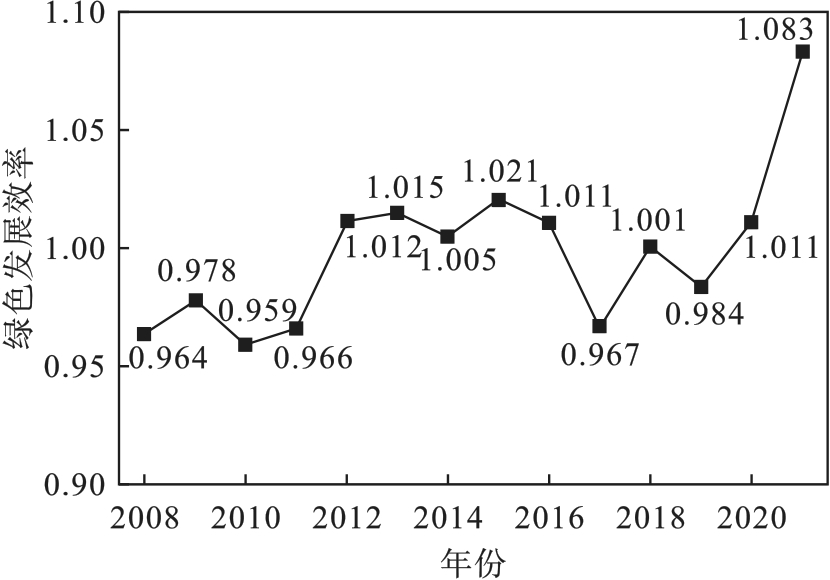
Fig.1 Static measurement results of green development efficiency in Chinese construction industry
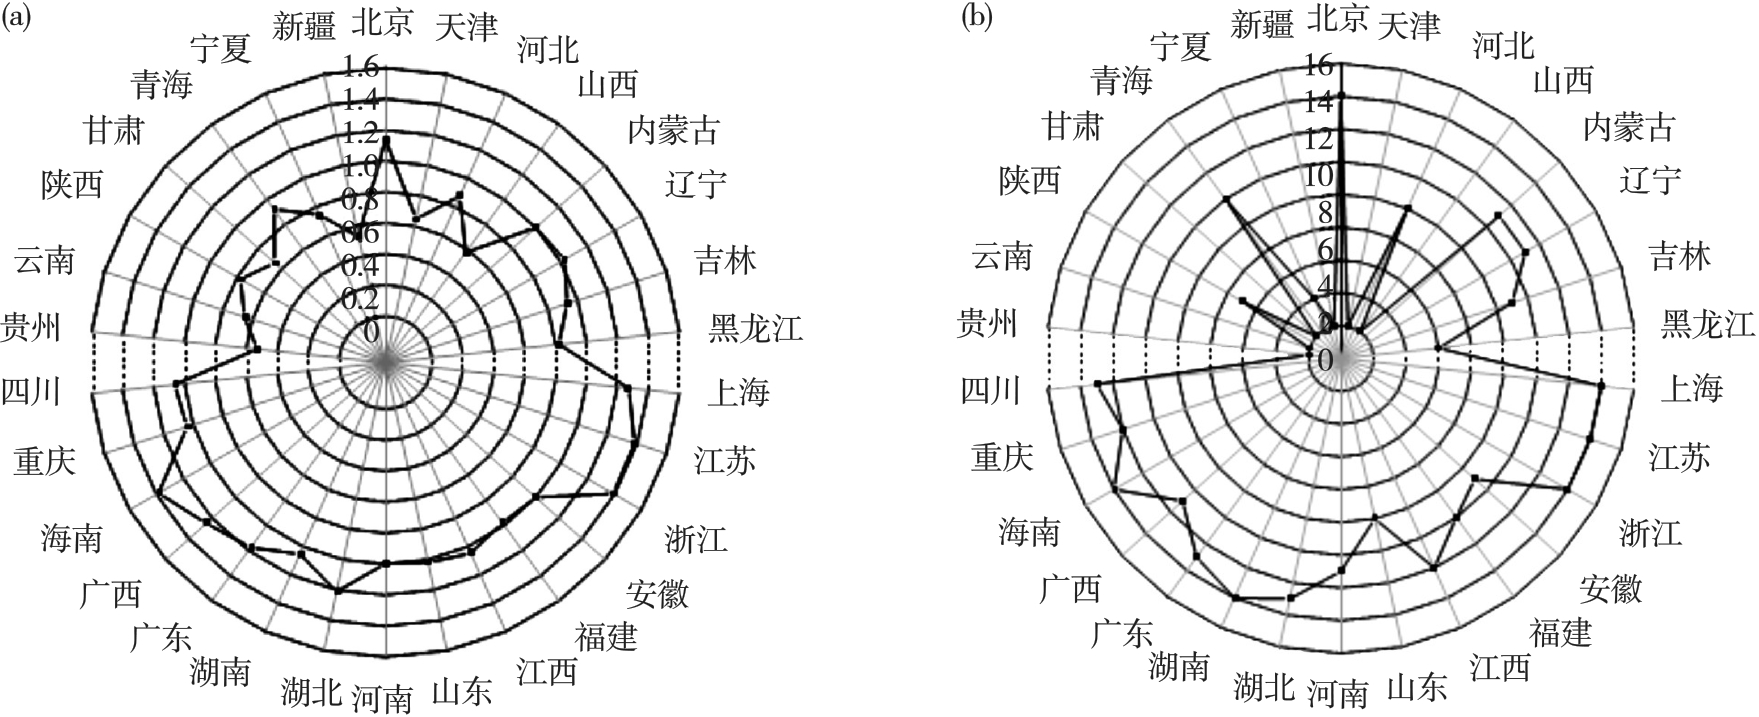
Fig.2 Calculation results of green development efficiency of the construction industry in provinces and autonomous regions
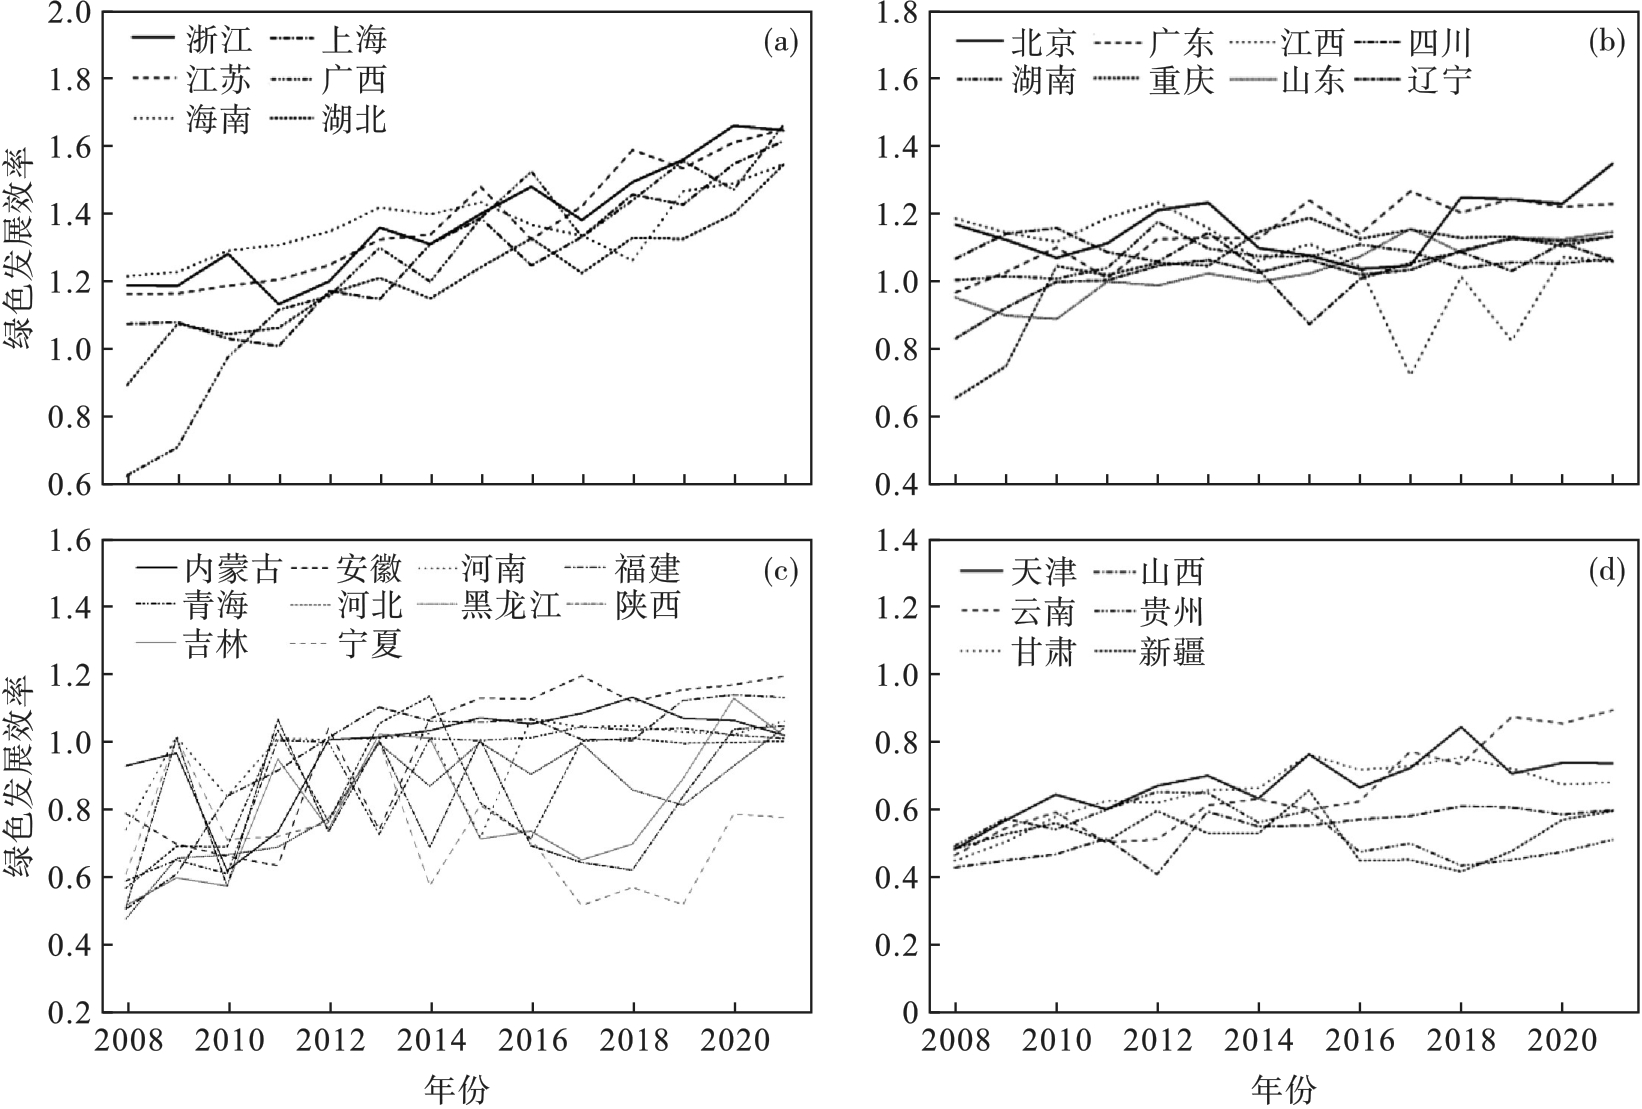
Fig.3 Trends of the green development efficiency of the construction industry in provinces and autonomous regions from 2008 to 2021
| 年份 | ML | EC | TC |
|---|---|---|---|
| 均值 | 1.017 | 1.000 | 1.017 |
| 2008~2009 | 1.014 | 1.000 | 1.014 |
| 2009~2010 | 1.006 | 1.000 | 1.006 |
| 2010~2011 | 0.987 | 1.000 | 0.987 |
| 2011~2012 | 1.023 | 1.000 | 1.023 |
| 2012~2013 | 1.075 | 1.000 | 1.075 |
| 2013~2014 | 0.981 | 1.000 | 0.981 |
| 2014~2015 | 1.081 | 1.000 | 1.081 |
| 2015~2016 | 0.981 | 1.000 | 0.981 |
| 2016~2017 | 1.015 | 1.000 | 1.015 |
| 2017~2018 | 0.976 | 1.000 | 0.976 |
| 2018~2019 | 1.003 | 1.000 | 1.003 |
| 2019~2020 | 1.035 | 1.000 | 1.035 |
| 2020~2021 | 1.046 | 1.000 | 1.046 |
Table 4 Time series calculation results of average green total factor development efficiency in the construction industry
| 年份 | ML | EC | TC |
|---|---|---|---|
| 均值 | 1.017 | 1.000 | 1.017 |
| 2008~2009 | 1.014 | 1.000 | 1.014 |
| 2009~2010 | 1.006 | 1.000 | 1.006 |
| 2010~2011 | 0.987 | 1.000 | 0.987 |
| 2011~2012 | 1.023 | 1.000 | 1.023 |
| 2012~2013 | 1.075 | 1.000 | 1.075 |
| 2013~2014 | 0.981 | 1.000 | 0.981 |
| 2014~2015 | 1.081 | 1.000 | 1.081 |
| 2015~2016 | 0.981 | 1.000 | 0.981 |
| 2016~2017 | 1.015 | 1.000 | 1.015 |
| 2017~2018 | 0.976 | 1.000 | 0.976 |
| 2018~2019 | 1.003 | 1.000 | 1.003 |
| 2019~2020 | 1.035 | 1.000 | 1.035 |
| 2020~2021 | 1.046 | 1.000 | 1.046 |
| 地区 | ML | EC | TC | 地区 | ML | EC | TC |
|---|---|---|---|---|---|---|---|
| 上海 | 1.248 | 1.066 | 1.170 | 四川 | 1.073 | 1.008 | 1.065 |
| 湖北 | 1.213 | 1.095 | 1.107 | 甘肃 | 1.072 | 1.085 | 0.988 |
| 安徽 | 1.209 | 1.085 | 1.114 | 云南 | 1.066 | 1.070 | 0.997 |
| 天津 | 1.206 | 1.122 | 1.075 | 江苏 | 1.063 | 1.085 | 0.980 |
| 吉林 | 1.190 | 1.091 | 1.092 | 山东 | 1.045 | 1.039 | 1.005 |
| 陕西 | 1.187 | 1.083 | 1.096 | 福建 | 1.038 | 0.992 | 1.047 |
| 广东 | 1.178 | 1.141 | 1.032 | 辽宁 | 1.036 | 1.044 | 0.992 |
| 北京 | 1.134 | 1.089 | 1.041 | 山西 | 1.025 | 1.031 | 0.995 |
| 广西 | 1.115 | 1.102 | 1.012 | 贵州 | 1.025 | 1.045 | 0.980 |
| 青海 | 1.111 | 1.081 | 1.027 | 内蒙古 | 1.022 | 1.037 | 0.986 |
| 海南 | 1.099 | 1.018 | 1.080 | 江西 | 0.989 | 1.019 | 0.971 |
| 河南 | 1.093 | 1.051 | 1.041 | 黑龙江 | 0.961 | 0.936 | 1.027 |
| 宁夏 | 1.091 | 1.062 | 1.028 | 湖南 | 0.954 | 1.052 | 0.907 |
| 重庆 | 1.084 | 1.054 | 1.028 | 浙江 | 0.946 | 0.996 | 0.951 |
| 河北 | 1.077 | 1.041 | 1.035 | 新疆 | 0.902 | 0.968 | 0.932 |
Table 5 Calculation results of average green total factor development efficiency of the construction industry in
| 地区 | ML | EC | TC | 地区 | ML | EC | TC |
|---|---|---|---|---|---|---|---|
| 上海 | 1.248 | 1.066 | 1.170 | 四川 | 1.073 | 1.008 | 1.065 |
| 湖北 | 1.213 | 1.095 | 1.107 | 甘肃 | 1.072 | 1.085 | 0.988 |
| 安徽 | 1.209 | 1.085 | 1.114 | 云南 | 1.066 | 1.070 | 0.997 |
| 天津 | 1.206 | 1.122 | 1.075 | 江苏 | 1.063 | 1.085 | 0.980 |
| 吉林 | 1.190 | 1.091 | 1.092 | 山东 | 1.045 | 1.039 | 1.005 |
| 陕西 | 1.187 | 1.083 | 1.096 | 福建 | 1.038 | 0.992 | 1.047 |
| 广东 | 1.178 | 1.141 | 1.032 | 辽宁 | 1.036 | 1.044 | 0.992 |
| 北京 | 1.134 | 1.089 | 1.041 | 山西 | 1.025 | 1.031 | 0.995 |
| 广西 | 1.115 | 1.102 | 1.012 | 贵州 | 1.025 | 1.045 | 0.980 |
| 青海 | 1.111 | 1.081 | 1.027 | 内蒙古 | 1.022 | 1.037 | 0.986 |
| 海南 | 1.099 | 1.018 | 1.080 | 江西 | 0.989 | 1.019 | 0.971 |
| 河南 | 1.093 | 1.051 | 1.041 | 黑龙江 | 0.961 | 0.936 | 1.027 |
| 宁夏 | 1.091 | 1.062 | 1.028 | 湖南 | 0.954 | 1.052 | 0.907 |
| 重庆 | 1.084 | 1.054 | 1.028 | 浙江 | 0.946 | 0.996 | 0.951 |
| 河北 | 1.077 | 1.041 | 1.035 | 新疆 | 0.902 | 0.968 | 0.932 |
| 1 | Cook W D, Seiford L M. Data envelopment analysis(DEA)-thirty years on[J]. European Journal of Operational Research, 2009, 192(1): 1-17. |
| 2 | 齐锡晶, 张晶钰, 季红男. 沈阳房地产开发行业发展效率评价与优化[J]. 东北大学学报(自然科学版), 2021, 42(6): 893-899. |
| Qi Xi-jing, Zhang Jing-yu, Ji Hong-nan. Development efficiency evaluation and optimization of Shenyang real estate industry[J]. Journal of Northeastern University (Natural Science), 2021, 42(6): 893-899. | |
| 3 | 齐锡晶, 戴子龙, 邓李杰, 等. 沈阳城市土地供应效率的评价与优化[J]. 东北大学学报(自然科学版), 2009, 30(31): 1657-1661. |
| Qi Xi-jing, Dai Zi-long, Deng Li-jie, et al. Evaluation and optimization of urban land supply efficiency in Shenyang[J]. Journal of Northeastern University (Natural Science), 2009, 30(31): 1657-1661. | |
| 4 | Tone K. A slacks-based measure of efficiency in data envelopment analysis[J]. European Journal of Operational Research, 2001, 130(3): 498-509. |
| 5 | Tone K. A slacks-based measure of super-efficiency in data envelopment analysis[J]. European Journal of Operational Research, 2002, 143(1): 32-41. |
| 6 | Caves D, Christensen L, Diewert D. The economic theory of Index numbers and the measurement of input,output and productivity[J].Econometrica. 1982, 50:1393-1414. |
| 7 | Chung Y H, Färe R, Grosskopf S. Productivity and undesirable outputs: a directional distance function approach[J]. Journal of Environmental Management, 1997, 51(3): 229-240. |
| 8 | 谭丹, 王广斌, 曹冬平. 建筑业全要素生产率的增长特征及其影响因素[J]. 同济大学学报(自然科学版), 2015, 43(12): 1901-1907. |
| Tan Dan, Wang Guang-bin, Cao Dong-ping. Growth characteristics and influencing factors of Total factor productivity of construction industry[J]. Journal of Tongji University (Natural Science), 2015, 43(12): 1901-1907. | |
| 9 | Luo M, Fan H Q, Liu G W. Measuring regional differences of construction productive efficiency in China[J]. Engineering, Construction and Architectural Management, 2020, 27(4): 952-974. |
| 10 | Luo M, Fan H Q, Liu G W. A target-oriented DEA model for regional construction productive efficiency improvement in China[J]. Advanced Engineering Informatics, 2021, 47: 101208. |
| 11 | Zhou Y X, Liu W L, Lyu X Y, et al. Investigating interior driving factors and cross-industrial linkages of carbon emission efficiency in China’s construction industry: Based on Super-SBM DEA and GVAR model[J]. Journal of Cleaner Production, 2019, 241: 118322. |
| 12 | 张普伟, 贾广社, 吴陆锋, 等. 考虑材料投入的建筑业碳生产率及其敛散性[J]. 同济大学学报(自然科学版), 2019, 47(1): 149-158. |
| Zhang Pu-wei, Jia Guang-she, Wu Lu-feng, et al. Carbon productivity and its convergence in construction industry by incorporating construction materials as input factors[J]. Journal of Tongji University (Natural Science), 2019, 47(1): 149-158. | |
| 13 | Kumbhakar S C, Lien G, Hardaker J B. Technical efficiency in competing panel data models: a study of Norwegian grain farming[J]. Journal of Productivity Analysis, 2014, 41(2): 321-337. |
| 14 | Färe R, Grosskopf S, Norris M. Productivity growth, technical progress, and efficiency change in industrialized countries: reply[J]. The American Economic Review, 1997, 87(5): 1040-1044. |
| [1] | Meng LI, Wen ZHAO, Xin WANG, Xiao-di LIU. Experimental Study on Muck Improvement of Clay Stratum in Earth Pressure Balance Shield [J]. Journal of Northeastern University(Natural Science), 2025, 46(4): 106-114. |
| [2] | Qi-long JIANG, Jian XU. Application of Improved PSO-PH-RRT* Algorithm in Intelligent Vehicle Path Planning [J]. Journal of Northeastern University(Natural Science), 2025, 46(3): 12-19. |
| [3] | Zhen-hui YU, Jing-xian LIU, Guo-dong LI, Chao LYU. Weighting and Counting Efficiencies of Filter Media of Bag Dust Collector [J]. Journal of Northeastern University(Natural Science), 2025, 46(3): 123-129. |
| [4] | Shu-hong WANG, Chen-xiang GAO, Qin-kuan HOU. Application of Improved Density Peak Clustering Algorithm in Dominant Grouping of Rock Discontinuities [J]. Journal of Northeastern University(Natural Science), 2025, 46(3): 130-137. |
| [5] | Xian-zhen HUANG, Xu WANG, Peng-fei DING, Zhi-yuan JIANG. Reliability Optimization of Process Parameters Considering Milling Surface Morphology [J]. Journal of Northeastern University(Natural Science), 2025, 46(3): 80-87. |
| [6] | Jun-yu YANG, Ming LI, Shuang SUN, Dong-sheng WEI. Safety Assessment Method for Steel Arch Bridge Based on Optimal Weights and Fuzzy Theory [J]. Journal of Northeastern University(Natural Science), 2025, 46(1): 134-144. |
| [7] | Xiao-ming CHEN, Jian-ye YU, Shun LIU, Chong ZENG. Lightweight Design of SUV Automobile Aluminum Alloy Wheel Hub Based on Finite Element Simulation [J]. Journal of Northeastern University(Natural Science), 2025, 46(1): 99-109. |
| [8] | Fang-ming LIU, Wei SUN. Dynamic Modeling and Stress Reduction Optimization of Series Pipelines Based on Pipe-Solid Element Coupling [J]. Journal of Northeastern University(Natural Science), 2024, 45(9): 1277-1286. |
| [9] | Li-jin FANG, Yue GAO, Xin-xing CAO, Yun-peng GONG. Multi-objective Optimization Allocation of Geometric Parameter Tolerances for Serial Robots Based on NSGA-II [J]. Journal of Northeastern University(Natural Science), 2024, 45(6): 829-836. |
| [10] | Tan LI, Hong WANG, Bo-pi JIN, Zhi-wei WU. Multi-source Physiological Energy Consumption Prediction for Exoskeleton Performance Evaluation [J]. Journal of Northeastern University(Natural Science), 2024, 45(6): 850-857. |
| [11] | Ke JING, Yu LIU, Le-hua LI. Two-Stage Stochastic Inventory Optimization for the Assemble to Order System [J]. Journal of Northeastern University(Natural Science), 2024, 45(6): 905-912. |
| [12] | Zhi-guo LU, Xiao WANG. Mechanical Arm Trajectory Planning Based on B-Spline and Whale Optimization Algorithm [J]. Journal of Northeastern University(Natural Science), 2024, 45(5): 683-689. |
| [13] | Yuan-yuan LIANG, Jun LIU, Ping-tao YI, Wei-wei LI. Stochastic Integrated Solution of Interval Rough Number Group G1 Method and Its Application [J]. Journal of Northeastern University(Natural Science), 2024, 45(2): 282-288. |
| [14] | An LI, Tao GUO, Hao LI, Sheng HONG. Robust Secure Communication Method for Intelligent Reflecting Surface-Assisted Cognitive UAV Network [J]. Journal of Northeastern University(Natural Science), 2024, 45(12): 1717-1725. |
| [15] | Jian QIU, Wen ZHAO, Bo LU, Xu SUN. Ground Deformation Characteristics and Parameter Optimization of Metro Stations Constructed by Novel Pipe Roofing Method [J]. Journal of Northeastern University(Natural Science), 2024, 45(11): 1645-1655. |
| Viewed | ||||||
|
Full text |
|
|||||
|
Abstract |
|
|||||